
Quant: Pair Trading Study
- Sora Capital A.C.

- Feb 22, 2025
- 4 min read
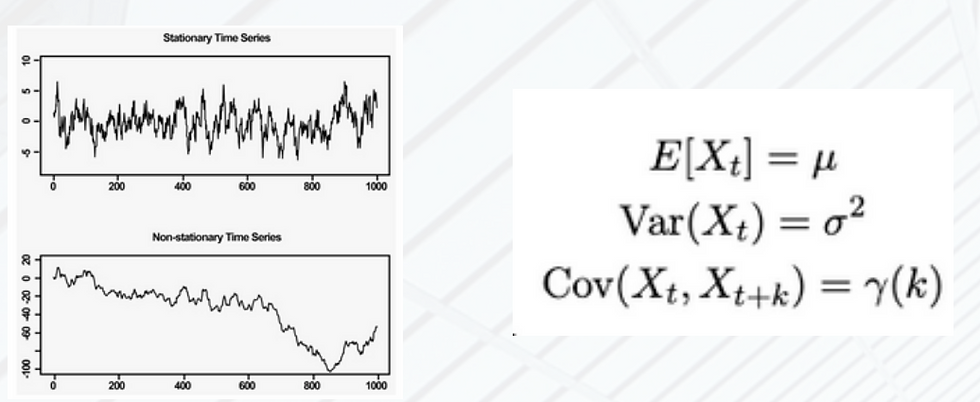
1) Importance of Stationarity in Pair Trading Strategies
Stationarity is critical in pair trading because it ensures that the spread between two correlated stocks has consistent statistical properties over time. This consistency allows for reliable mean reversion, where deviations from the mean spread can be used to generate buy or sell signals. Without stationarity, the predictive power of the spread diminishes, leading to unreliable trading signals and potential losses.
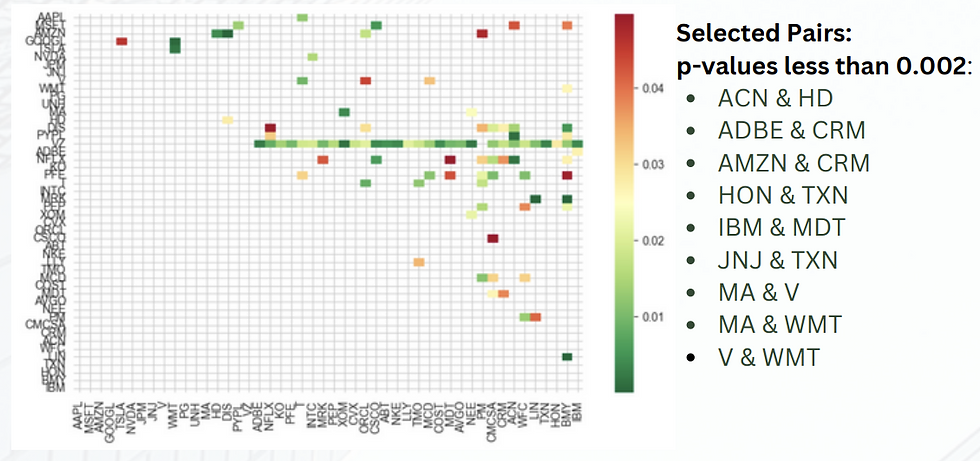
2) Pair Selection and Cointegration Testing
We performed pairwise analysis on the 48 stocks to identify pairs with strong mean-reverting behavior. We applied the Engle-Granger two-step method to test for cointegration, which is more robust than simple correlation. The heatmap visualizes the p-values from the cointegration tests for each pair of stocks. Only pairs with p-values less than 0.002 were considered significant and likely to maintain a stable relationship over time.
3) Strategy Implementation: Utilizing the Spread
To implement the pair trading strategy, we calculated the spread between each selected stock pair using linear regression. Specifically, we regressed one stock’s price against the other to determine the coefficient β which quantifies the linear relationship between the two securities. The spread was then computed as follows:
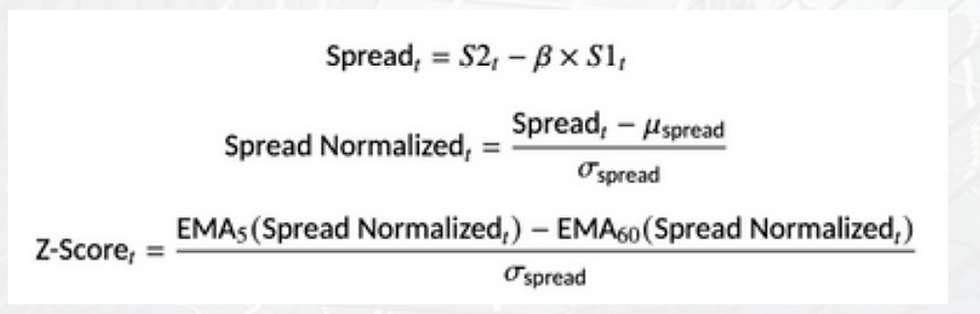
After determining the spread between two stocks through linear regression, we normalize this spread to ensure consistent mean and variance. We then calculate the z-score by comparing short-term (5- period) and long-term (60-period) exponential moving averages (EMAs) of the normalized spread.

The z-score quantifies how far the spread has deviated from its long-term average, allowing us to make informed buy or sell decisions based on the principle of mean reversion. By setting thresholds on the z-score, we ensure that trades are executed only when the spread
exhibits statistically significant divergence, thereby enhancing the robustness and reliability of our trading strategy.
4) Train-Test Split and Visualization
To validate the robustness of our pair trading strategy, we divided the data into training and testing sets with a 60:40 ratio. The training set (60% of the data) was used to calculate the spread, normalize it, and derive the z-score. The testing set (40% of the data) was then utilized to backtest the strategy and evaluate its performance on unseen data.
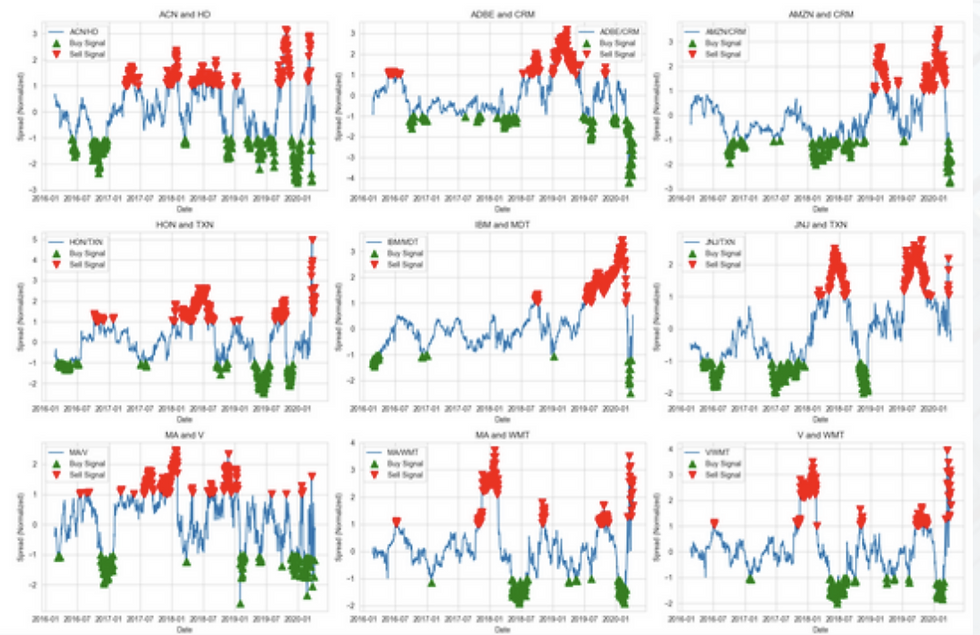
Visualization
The figure above displays the normalized spread and corresponding z-scores for several selected pairs during the testing period. Buy and sell signals are indicated by green and red markers, respectively. This visualization demonstrates how the strategy capitalizes on meanreverting behavior, triggering trades when the spread significantly deviates from its mean. Each subplot corresponds to one of the nine selected pairs with pvalues less than 0.002, illustrating the strategy's effectiveness across different pairs.
To enhance the robustness of the pair trading strategy, we incorporate out-of-sample testing to evaluate its adaptability across different market conditions. Rolling window analysis ensures that the model parameters remain responsive to market changes by continuously updating the spread and z-score. Additionally, integrating transaction cost analysis allows us to assess the impact of trading fees and slippage on profitability.

5) Analysis of Pair Trading Results
The results of the pair trading strategy show a total portfolio value increase to $129,889.95, a nearly 30% gain from the initial $100,000 investment. However, performance varied significantly across pairs.
Top Performers: Pairs like MA & WMT ($20,319.43) and V & WMT ($13,712.25) generated substantial returns, indicating strong mean reversion and successful signal generation.
Underperformers: ADBE & CRM and IBM & MDT incurred losses of $9,715.58 and $2,104.24, respectively. These losses suggest potential overfitting, weak cointegration, or excessive volatility, leading to false trading signals.
Strategic Insights: The concentration of gains in a few pairs suggests that the strategy could benefit from refined pair selection criteria or adaptive thresholds for signal generation. Additionally, reviewing stop-loss mechanisms and position sizing could mitigate losses in underperforming pairs, enhancing overall riskadjusted returns.
Conclusion: While the strategy demonstrated overall profitability, the variation in pair performance underscores the need for continuous refinement, particularly in the areas of pair selection, signal validation, and risk management. Further backtesting and optimization are recommended to improve the strategy's consistency and robustness across different market conditions.
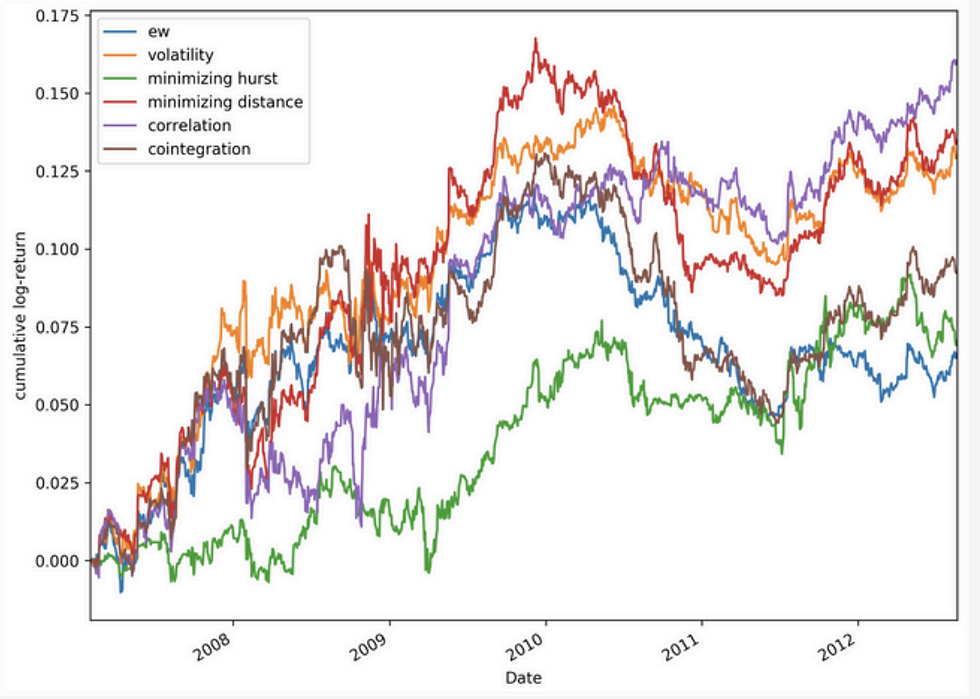
The chart above, sourced from MDPI, compares the cumulative log-returns of portfolios composed of 10 pairs, selected using methods like volatility, correlation, and cointegration from 2007 to 2012. It demonstrates how different pair selection techniques impact portfolio performance, with cointegration showing relatively stable returns and other methods exhibiting more variability.
6) Real World Examples:
Statistical Arbitrage Desks: Large investment banks like Goldman Sachs and Morgan Stanley employ statistical arbitrage desks where pair trading is a core strategy.
These desks exploit short-term pricing inefficiencies between correlated stocks.
Renaissance Technologies: This quant-driven hedge fund uses advanced algorithms for pair trading among other strategies. They often trade pairs of stocks that are historically correlated, capitalizing on temporary divergences.
Two Sigma: Another quant hedge fund known for pair trading, focusing on large datasets to identify and execute trades on correlated securities.
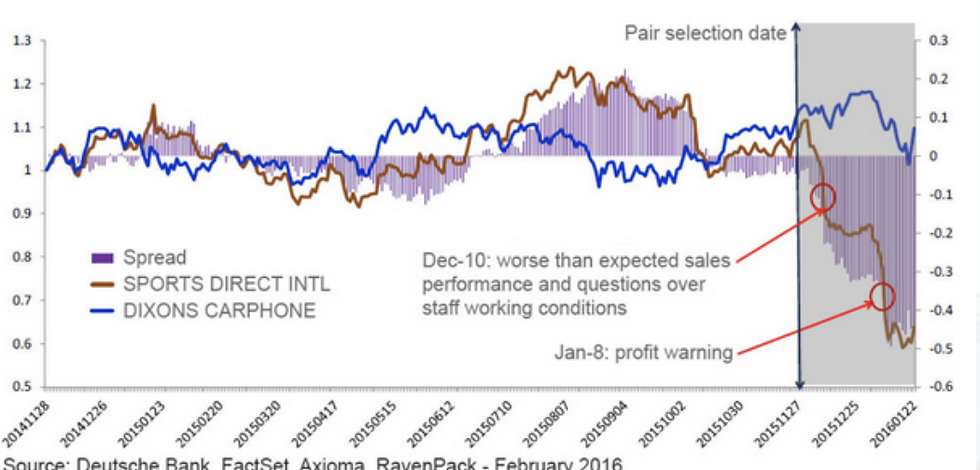
One notable real-world application of pair trading involves integrating news sentiment analysis into the strategy. Deutsche Bank demonstrated this by using RavenPack’s news analytics, which significantly improved the performance of traditional pair trading.
By incorporating real-time news data, the percentage of non-converging pairs dropped from 15% to 7%, and average profit per pair increased. This approach allows traders to adjust positions based on the sentiment, reducing divergence risk and enhancing returns.
From November 2014 to January 2016, Deutsche Bank applied this enhanced pair trading strategy to the pair of Sports Direct International plc and Dixons Carphone plc, successfully reducing risk and boosting profitability by leveraging news sentiment to better time trades. This example illustrates how combining pair trading with external data like news analytics can refine trading decisions and improve overall strategy effectiveness.}
Sources: Kaggle, Yahoo Finance, Deutsche Bank Research, MDPI, QuantConnect
Author: Jinye Bao (September 2024)


Comments